


What’s Your Investment’s Price Tag?
Some of the initial shine has worn off post-election, but at least it’s dark by 5…
In today’s email:
- How is the “price tag” on the stocks determined?
- A week later and the markets are sensing some concerns with the new administration and have reacted accordingly.
- Have you maxed out your TFSA and looking for another tax-free investment vehicle? We might have the answer.
The Scoop
Have you ever walked into a store, looked at a price tag, and thought, “Is this really worth it?” Well, investing in stocks is no different—except the price tags are a tad more complicated. Today, we’re diving into the world of Price-to-Earnings (P/E) ratios, the sticker price of the stock market. Buckle up; it’s going to be a fun ride (yes, finance can be fun!).
What Exactly is a P/E Ratio?
Think of the P/E Ratio as the amount you’re willing to pay for one dollar of a company’s earnings. It’s calculated by dividing the current market price per share by the earnings per share (EPS). For instance, if a company’s stock is trading at $100 and the EPS is $5, the P/E ratio is 20. This means investors are willing to pay $20 for every $1 of earnings.

Since the P/E ratio is the calculation of purchasing earnings from a company, using the above example, how long would it take to “earn back” your investment? If you’re paying $20 for every $1 of earnings, it would theoretically take 20 years to recoup your initial investment, assuming those earnings remain consistent and are fully distributed to shareholders.
Think of it this way: you’re investing $20 to get an annual return of $1. After 20 years of earning $1 each year, you’d have your original $20 back. It’s like buying a coffee machine for $20 that saves you $1 each year on cappuccinos; after 20 years, the machine has effectively paid for itself (though it might be time for an upgrade by then!).
However, in the real world, it’s a bit more complex. Companies usually don’t distribute all their earnings as dividends; they often reinvest a portion back into the business to fuel growth. If the company’s earnings grow over time, you could recoup your investment faster than 20 years. For example, if earnings per share increase by, say, 10% annually, you’d reach your break-even point sooner thanks to the magic of compounding.
**Why should you care about the P/E ratio? **
It’s like a thermometer for stock valuation, helping investors gauge whether a stock is overvalued, undervalued, or just right—much like Goldilocks searching for the perfect porridge. A high P/E ratio may indicate high investor expectations and optimism about future growth. On the flip side, a low P/E ratio could suggest that the stock is undervalued or that the company is facing challenges.
How has this worked historically?
Let’s take a stroll down memory lane with some historical examples—the good, the bad, and the downright ugly. Back in the early 2000s, companies like Apple had relatively modest P/E ratios while they were innovating with products like the iPod and later the iPhone. Investors who saw the growth potential despite the unassuming P/E were rewarded handsomely. During the dot-com bubble, many companies with astronomical P/E ratios—or none at all due to lack of earnings—attracted investors like moths to a flame. We all know how that ended: a collective singeing of portfolios. And who could forget the financial crisis of 2008? Banks had low P/E ratios, but for a good reason—they were sitting on piles of toxic assets. Buying based solely on a low P/E would have been like buying a car because it was cheap, only to find out it has no engine.
In today’s market, P/E ratios continue to be a valuable tool, but they should be used wisely. Some established companies maintain P/E ratios that reflect steady performance and stable earnings, offering a sense of reliability. Others, particularly in high-growth industries, might sport higher P/E ratios, reflecting investor optimism about future prospects. It’s essential to dig deeper and consider factors like industry trends, company fundamentals, and overall market conditions.

A few words of wisdom
While P/E ratios are a handy tool, they’re not a crystal ball. They should be used in conjunction with other metrics and qualitative factors. After all, even the best chefs need more than one ingredient to create a masterpiece.
Let’s keep the conversation going. Got questions or amusing stock market anecdotes? Feel free to share! Investing doesn’t have to be a solo journey—or a dull one.
Market Minute
After an exuberant market rally following the U.S. election, markets have had some second thoughts. Let’s take a look at what happened in the Canadian and U.S. markets last week.
Canadian Markets:
The S&P/TSX Composite Index exhibited mixed performance throughout the week. On Tuesday, the index reached a record high, supported by gains in the technology sector, notably with Shopify’s shares surging over 20% following strong earnings results. However, by Friday, the index edged lower, influenced by declining oil prices and cautious comments from U.S. Federal Reserve Chair Jerome Powell regarding future interest rate cuts.
U.S. Markets:
In the United States, major stock indices faced declines, particularly on Friday. The S&P 500 fell by 1.3%, marking its worst loss since Election Day, while the Dow Jones Industrial Average dropped 0.7%, and the Nasdaq Composite decreased by 2.2%. This downturn was attributed to diminishing post-election optimism and concerns over potential policy changes under the incoming administration.
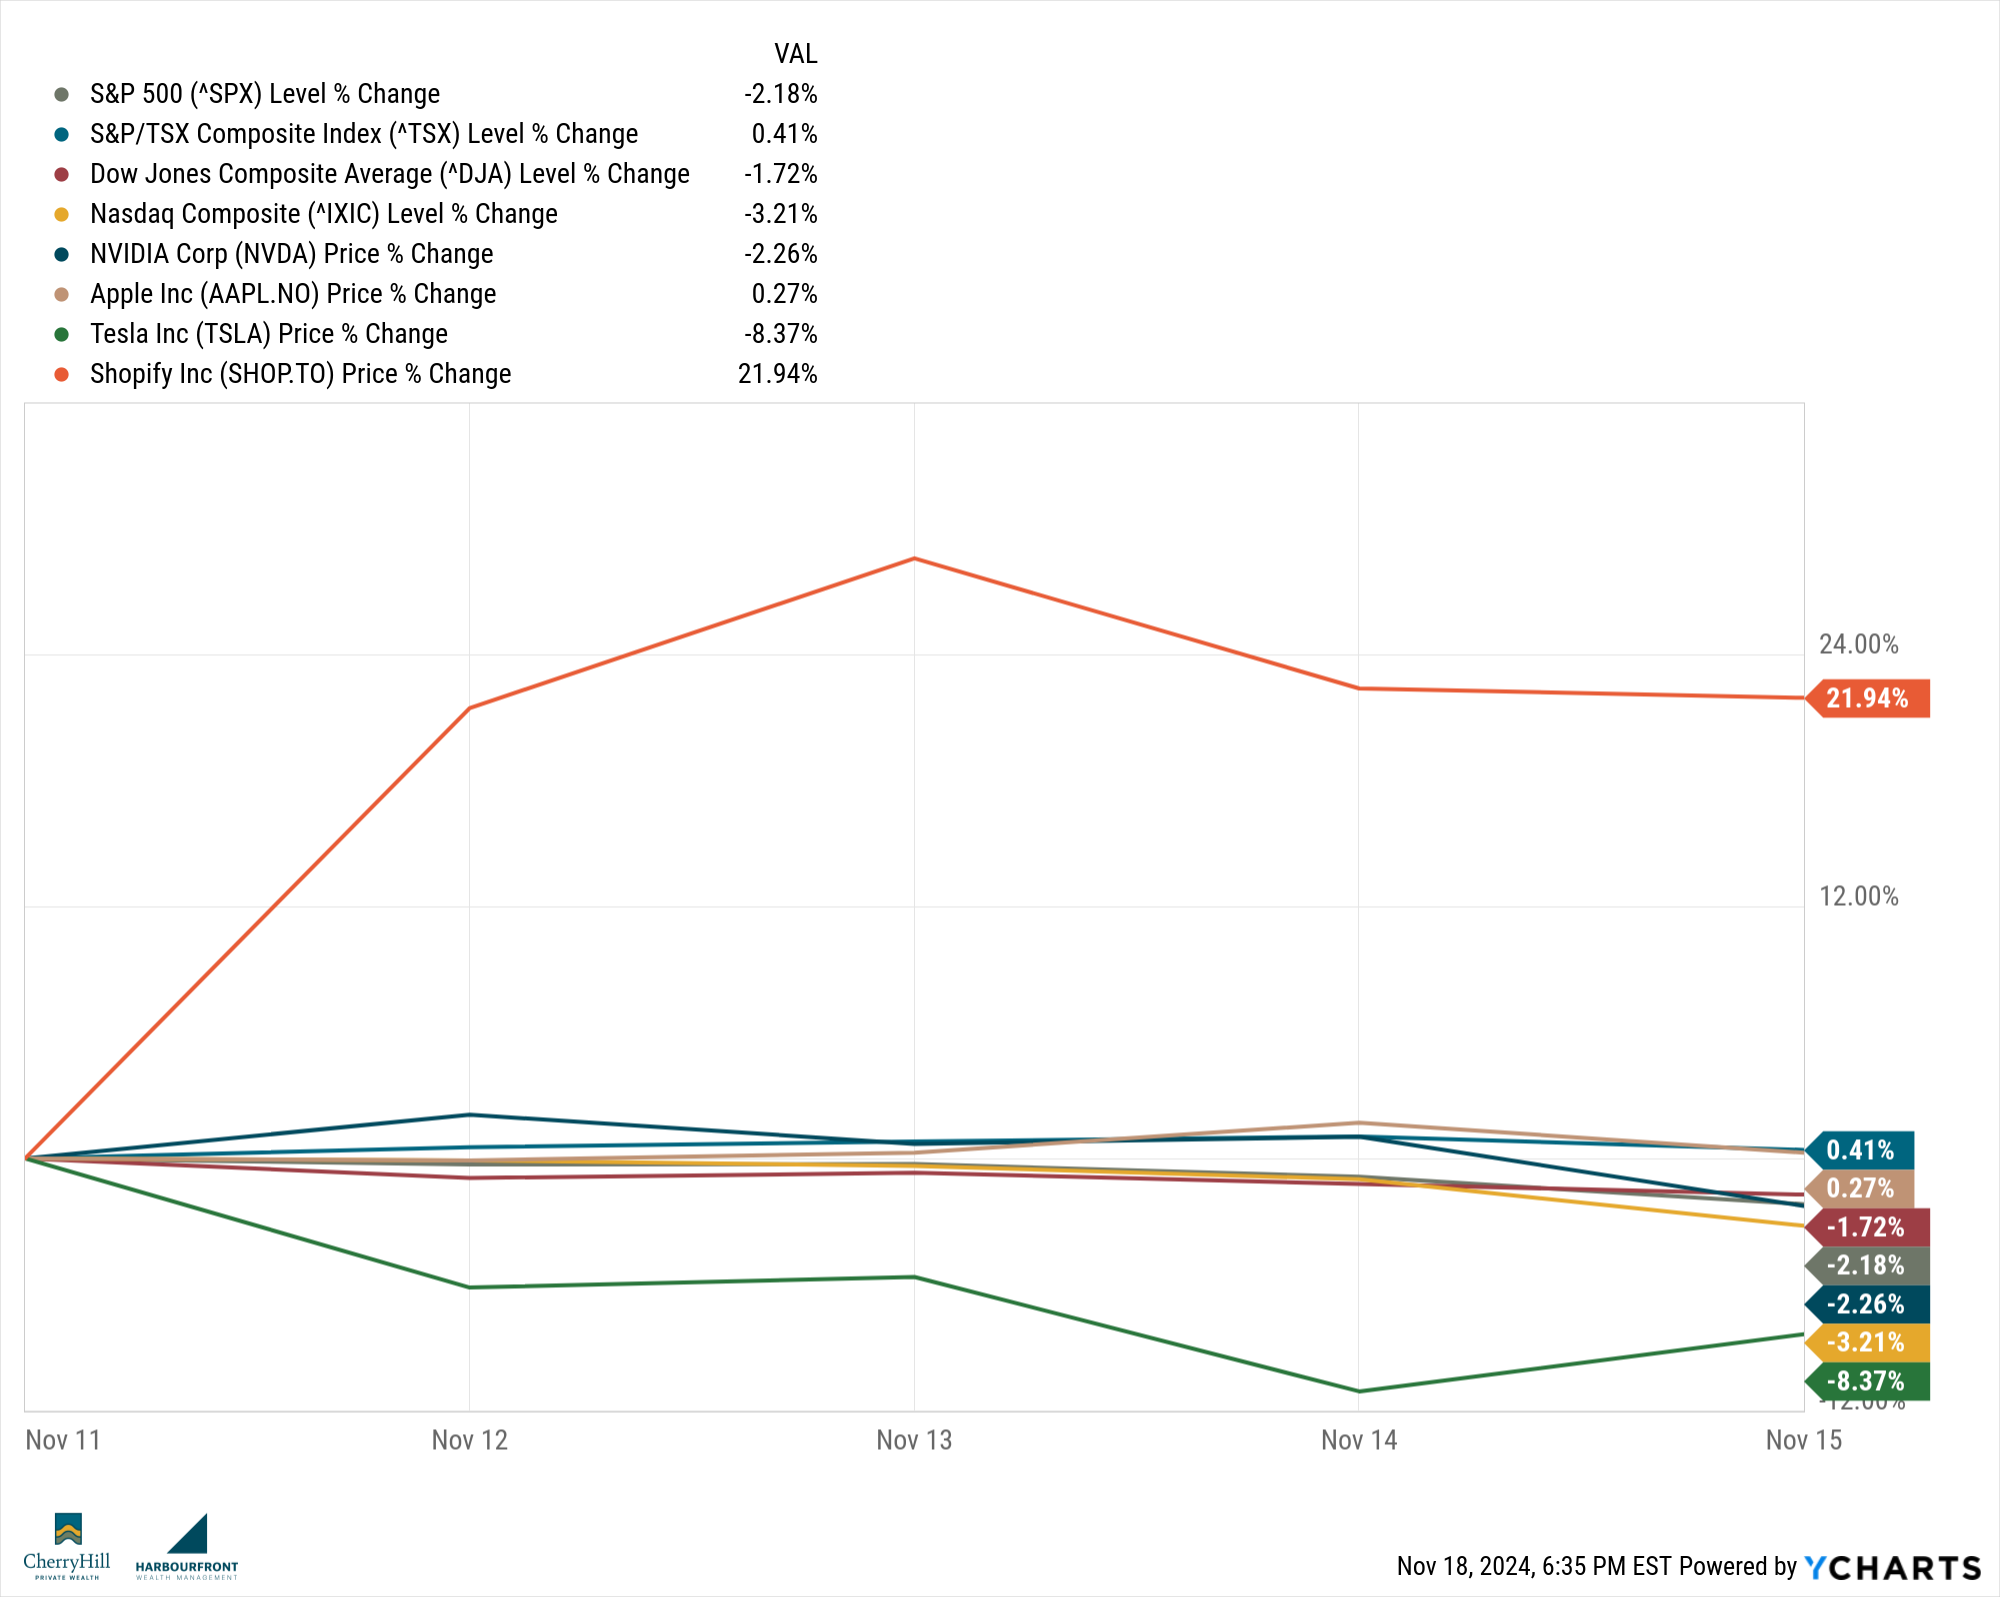
This week we’re watching several items:
*Corporate Earnings Reports: *Investors are closely monitoring earnings reports from major companies, including Nvidia, Walmart, Lowe’s, and Target. Nvidia’s upcoming report is particularly anticipated, as it could significantly influence the near-term direction of the U.S. stock market.
Economic Data Releases: In Canada, the release of the Consumer Price Index (CPI) data is expected to provide insights into inflation trends, potentially impacting the Bank of Canada’s policy decisions. In the U.S., housing starts and building permits data are scheduled for release, offering a glimpse into the health of the housing market.
Market Reactions to Geopolitical Events: Global markets are reacting to ongoing geopolitical developments, including trade negotiations and political transitions, which may influence investor sentiment and market volatility.
The CHPW Team
Part of our role as Certified Financial Planning Professionals is to have a look at all aspects of our client’s financial lives. One aspect that often doesn’t get talked about nearly enough is how to use life insurance to grow your wealth. When the Ultra Wealthy build out their wealth creation and retention strategies, they often utilize insurance to build wealth. You can hear in our conversation with Kelso Beggs, from PPI, just how big some of these policies can get.
Of course, most of us regular folks won’t have policies in eight-figure range, but thinking about insurance to help grow your wealth can make a huge difference during your retirement years. Oh, and did I mention - it can be tax-free!
Listen to our conversation with Kelso here.
Until next time, stay informed and strategically invested.
Trevor