


All Second Opinions Aren’t Created Equally
September is likely my favourite time of the year, with the weather (typically) cooperating so we can get out and take part in all the great outdoor activities. I hope you’ve been able to get out and enjoy this changing season!
In today’s email:
- Markets are all over the place - when was the last time you looked at risk differently than whether you’re in a “balanced” or “growth” portfolio? We have a look at how you can evaluate the risk in your portfolio using a couple easy numbers.
- The Canadian and US markets took a hit last week, but is this a trend or a blip?
- Our Quarterly Commentary is in, hear what our experts are saying.
- What the heck is Bitcoin? Should this be a part of your portfolio? We ask Purpose Investment’s CIO Greg Taylor these questions and more.
- We’ve added a new section that highlights an investment opportunity that we think you should know about. This week we see some great numbers coming from an RBC Structured Note offering.
The Scoop
Is it Time for a Second Opinion?
I recently received an email from a long-time client who had a second opinion on her investments from another financial advisor. She’s turning 71 this year, and like many of us facing big life transitions, she’s evaluating her options—something we’ve all done at some point. After all, it’s only natural to reassess.
The other advisor noticed she had a significant portion of her portfolio in “Alternatives” and immediately raised a red flag. It was clear he wasn’t too familiar with what these types of investments entail, and without much context, labeled them as “too risky.” Now, we’ve touched on Alternatives in previous newsletters—what they are, what they aren’t. If you missed that, you can check it out here. The advisor’s claim was that Alternatives are inherently riskier than the cookie-cutter options he had access to. But as I’ve explained before, Alternatives encompass a broad range of investments, basically anything outside of the standard stock, bond, mutual fund, or ETF categories.
This whole situation got me thinking about how we evaluate risk in our portfolios. You’ve likely heard terms like “risk-adjusted returns” or the “risk-free rate,” but what risks are we really taking on? And is it worth it? When the market is thriving, we tend to push these concerns to the back of our minds—just like we don’t think much about health insurance until we’re sick.
There are a lot of ways to measure risk, but I want to focus on two key metrics that can provide a lot of insight without needing a PhD in economics.
Standard Deviation: Back to Basics
If the term “Standard Deviation” didn’t bring back memories of high school math that made you want to throw your device, stay with me. In simple terms, Standard Deviation (SD) measures how much returns deviate from the average.
The lower the SD, the better—it means the returns don’t swing too far from the norm. For example, the RBC Select Growth Portfolio has a SD of 10.00% over the last 3 years, with a total return of 2.95%. This means that 68% of the time, you can expect returns to fall between 12.95% and -7.05%. It’s a good way to gauge how much fluctuation you might experience with an investment.
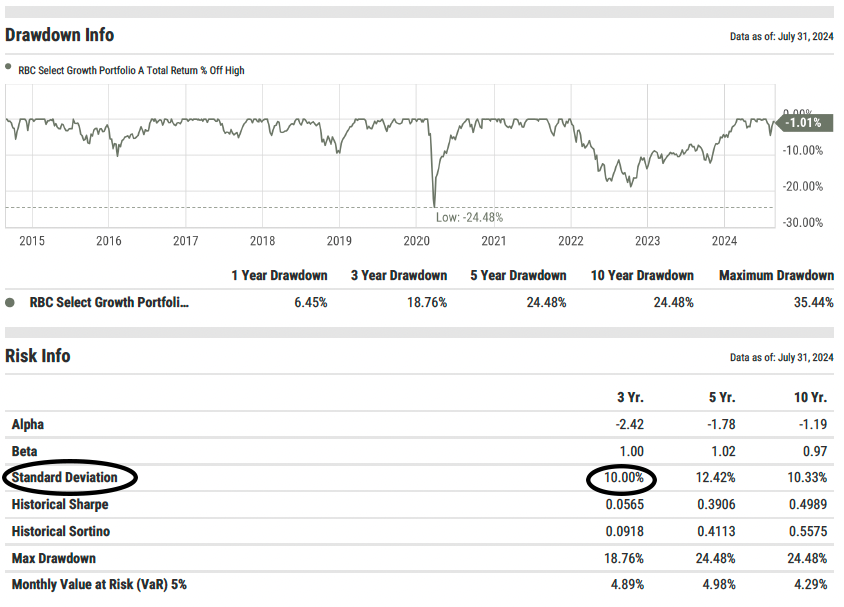
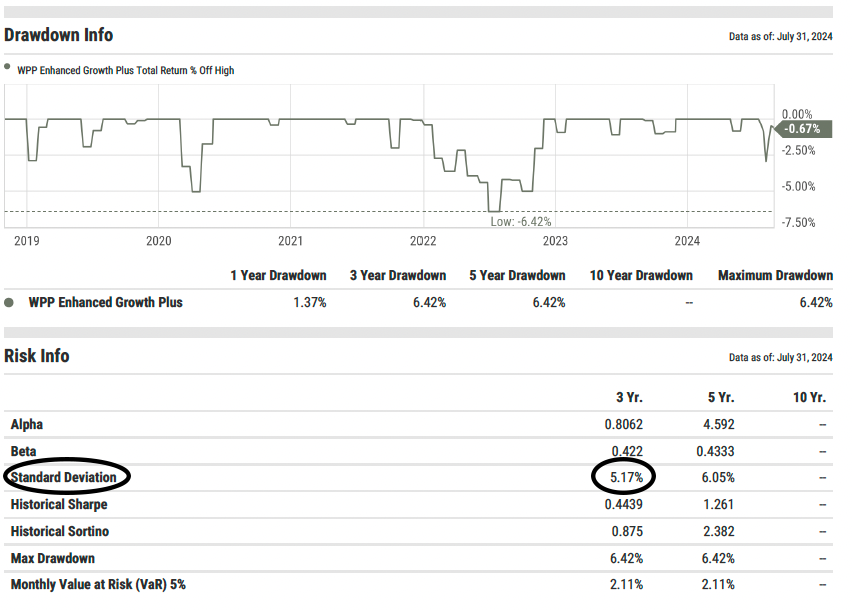
So, where do Alternatives fit into this? Do they help reduce risk or add to it? Sure, you can include higher-risk Alternatives, but our in-house mandate is focused on downside protection. Over the past three years, including 2022, our Enhanced Growth Plus portfolio had a standard deviation of 5.17%, almost half of RBC’s portfolio—and even lower than their balanced fund. And it gets better: our portfolio outperformed with a 5.46% return compared to their 2.95%. This means that nearly 70% of the time, our fund is delivering positive returns. So, you’re not just getting lower risk—you’re getting better performance.
Maximum Drawdown: Measuring the Worst-Case Scenario
I’m not picking on RBC here—Scotia, Manulife, BMO, and Investors Group have similar profiles. In fact, every EFT or mutual fund I looked at was basically the same.
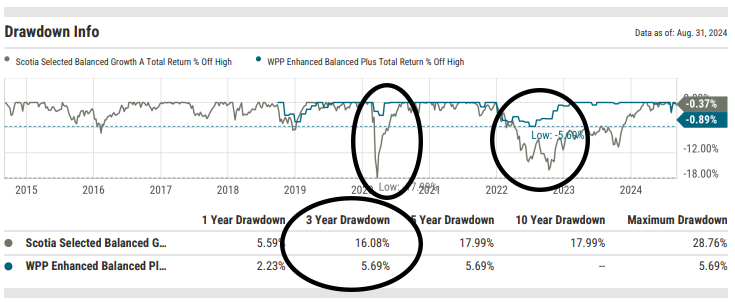
One of the other key metrics I like to consider is Maximum Drawdown, which measures the largest drop from a portfolio’s high to its low. It doesn’t tell you if or how quickly it bounced back, but it gives a good snapshot of how much it could lose at its worst. For instance, the S&P 500 had a maximum drawdown of 33.93% in 2020, but the 5-year maximum drawdown for the Scotia Essentials Balanced Fund was 18.27% (RBC and Investors Group had even bigger drops). This is because a balanced portfolio has less exposure to equities, so it essentially did what it was supposed to do. But can you stomach an almost 20% drop in your balanced portfolio?
Now, if you add Alternatives that focus on downside protection, do these rough patches seem less rough? Looking at our WPP Enhanced Balanced Plus portfolio over the same 5-year period, the maximum drawdown was just 5.69%. Again, you could accept higher risk for higher returns, but you need to understand the volatility that comes with it. In this case, our WPP fund delivered a 5-year return of 8.46%, compared to Scotia’s 4.33%.
The Bottom Line
Investing in Alternatives can seem riskier on the surface, but it all depends on which Alternatives you choose. Many of the strategies used by ultra-high-net-worth investors, pensions, and endowments are designed to provide downside protection. Whether Alternatives are right for you or not, it’s important to know the risks in your portfolio. Average returns only tell part of the story—it’s the fluctuations from the norm that can make all the difference.
Market Minute
This past week, our Watermark Portfolio team released their monthly market commentary, which you can read here.
Well, the major markets had a rough week.
In the US, equity markets kicked off September with declines, particularly in technology stocks, led by major losses with heavyweights like Nvidia. Some of the recent earning reports have indicated a slow down from the extraordinary gains we’ve seen so far this year. There was also broader weakness as we saw more pressure on the energy and oil stocks, which dropped due to concerns over weaker demand from China and potential increases from OPEC+ coming soon.
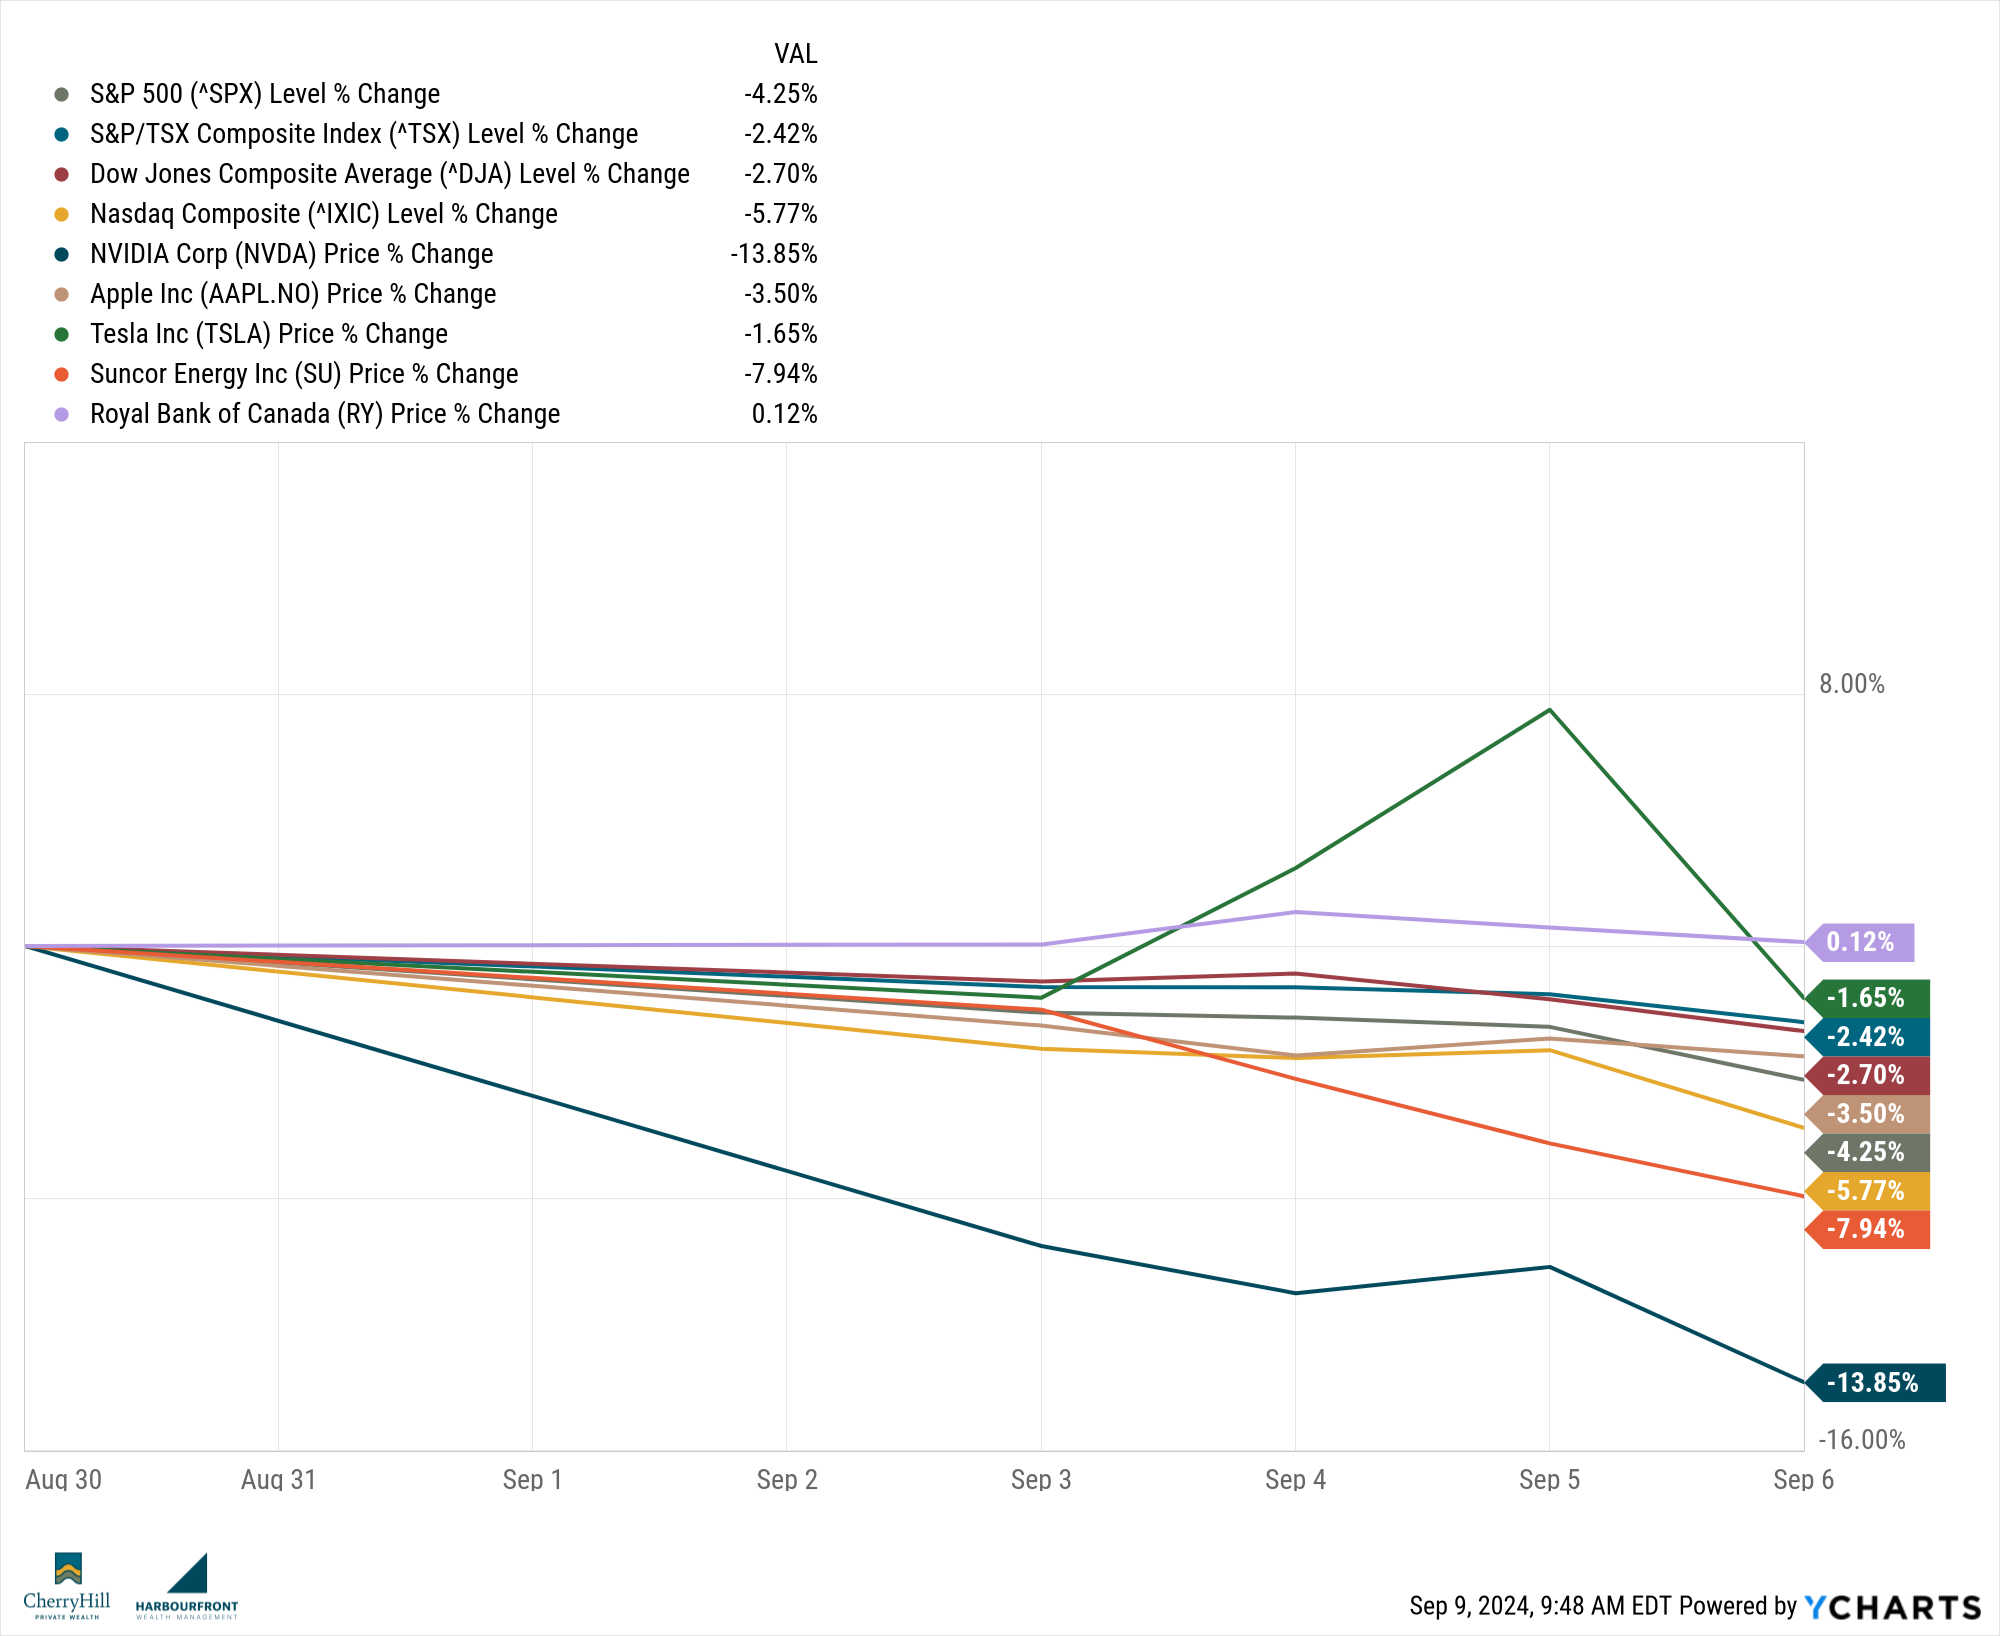
In Canada, there were similar results, with declines over 2% in the TSX. This was lead by weakness in the energy and financial sectors. The Canadian GDP, however, continued to post stronger-than-expected results. As I discussed last week, this could be very misleading since many of the individual measurable, like unemployment (now at 6.6%) keep moving in a negative trend.
Trends to Watch
- Federal Reserve Meetings (September 17-18): Although it appears to be a foregone conclusion at this point that the Feds will lower interest rates, there has been much discussion on the amount. The amount that the Feds lower rates by can signal future cuts and better give us direction on where rates are heading for the foreseeable future.
- Canadian Inflation Report (September 19): Inflation in Canada appears to be moderating, but is still above target. With the inflation numbers coming out soon, it will be critical in determining the Bank of Canada’s next move.
- Oil & Energy: After recent declines in oil prices due to concerns over weak Chinese demand and potential increases in OPEC+ output, the energy sector remains under pressure.
- US Retail Sales and Economic Data: Retail and industrial sales production numbers are expected this week. These will provide insights into the strength of consumer spending and overall health of the US economy.
The Lighter Side
Sticking with the back-to-school theme, a Bloomberg article caught my attention and I just had to share it with you!
For many businesses, the weeks between the start of July and Labour Day are a quiet time. Not so for Crayola! During the summer months, the company churns out at least 13 million crayons every day! As parents are getting their little ones ready to go back to school, Crayola sells about 1/2 of their annual crayons during this time.
After reading this article I went down the Crayon rabbit hole and found some other interesting facts!

- The name Crayola: It was coined by co-founder Alice Binney, combining the French word “craie” (meaning chalk) with “ola” (from “oleaginous”, meaning oily). Together, it translates to “oily chalk”.
- **First Box of Crayons: **It was sold in 1903 and included just 8 colours: black, brown, blue, purple, red, orange, yellow, and green. It cost only 5 cents!
- **The Crayon Smell: **The smell of crayons is so distinctive that it ranked 18th in familiarity in a 2000 study by Yale University. Crayola has since patented their unique odour.
Almost nothing says “nostalgia” like holding a Crayon in your hand and trying to colour inside the lines (my seven year old says I need more practice).
The CHPW Team
If you haven’t checked it out yet, have a listen (or watch) of our conversation with the CIO from Purpose Investments. We pick Greg’s brain on all things Crypto, so if you’ve ever thought about owning this product, or just want to know what it is, this podcast is for you!
With Bitcoin now available as an EFT, it’s becoming more mainstream, but is it something we should have in our portfolio? We ask Greg Taylor all the hard questions and you can hear it here!
Across Our Desks
During a recent conversation with a client, he mentioned an investment vehicle that someone in his network had brought up. We’ve been discussing internally how best to share potential opportunities with you—strategies or products that we believe could benefit some of our clients. We want to make sure you hear about these directly from us. While this won’t be a weekly segment, we’ll occasionally provide a quick synopsis of what we’re hearing about in the industry.
RBC Solactive Canada Blue Chip II AR Index Callable Contingent Yield 11.52% Securities
This week a few members of Cherry Hill had a conversation with the RBC Global Asset Management team to discuss Structured Notes. Without going too deep into what a structured note is (we can have a call to discuss further, if you’re interested), it’s essentially an income-generating product that is linked to an individual security or basket of securities, provides some downside protection, but can also have different levels of risk (crystal clear, right?). RBC has a wide variety that offer different protections, but the one that intrigued me right now is linked to a basket of blue chip stocks. It will pay out 11.52% if the value stays above the 80% barrier (here).
There is a lot more to know about this kind of product, but vehicles like structured notes can supplement a portfolio, giving monthly income at good rates when other interest-bearing products are decreasing in value. If you are interested in knowing more, please speak to your advisor or reaching out to one of the Cherry Hill advisors to know if this product is right for you.
Until next week, happy investing!
Trevor