

Making Sense of your Annual Statement
Happy Monday, !
My wife, unfortunately, had to work this weekend and it took a few minutes on Sunday morning for her to realize why she was so groggy when her alarm rang. While most of us enjoyed our usual amount of sleep, albeit with the clock nudging us an hour ahead, she was not so lucky. Ah, the joys of daylight savings time!
As we bid adieu to RRSP season and the rush to maximize our contributions for 2023, we welcome another thrilling period—tax season! I know the mere thought of financial statements and deciphering annual investment reports sends shivers down the spines of many (normal) people.
Over the past few weeks, I’ve had numerous discussions with clients, trying to demystify their statements. The burning question on everyone’s mind is simple: “What was my starting balance, and what do I have now?” Let’s dive into the statements you’ll receive from us and attempt to clarify the maze of numbers and regulatory lingo.
For those invested in our Private portfolios, you’ll receive two statements: one fulfilling all regulatory requirements and another from our Watermark Private Portfolio (WPP) team. The WPP statement can be tailored to include a comprehensive breakdown for the entire family, providing information that’s pertinent to you, and is much easier to understand. Recent regulations have pushed for a more standardized statement, aiming to simplify comparisons between institutions and investments. However, this hasn’t necessarily made things easier for us to decipher. These changes also had to be approved by the major institutions, so there were some compromises (e.g., they chose to start the standardized reporting period just after the Financial Crises market crash).
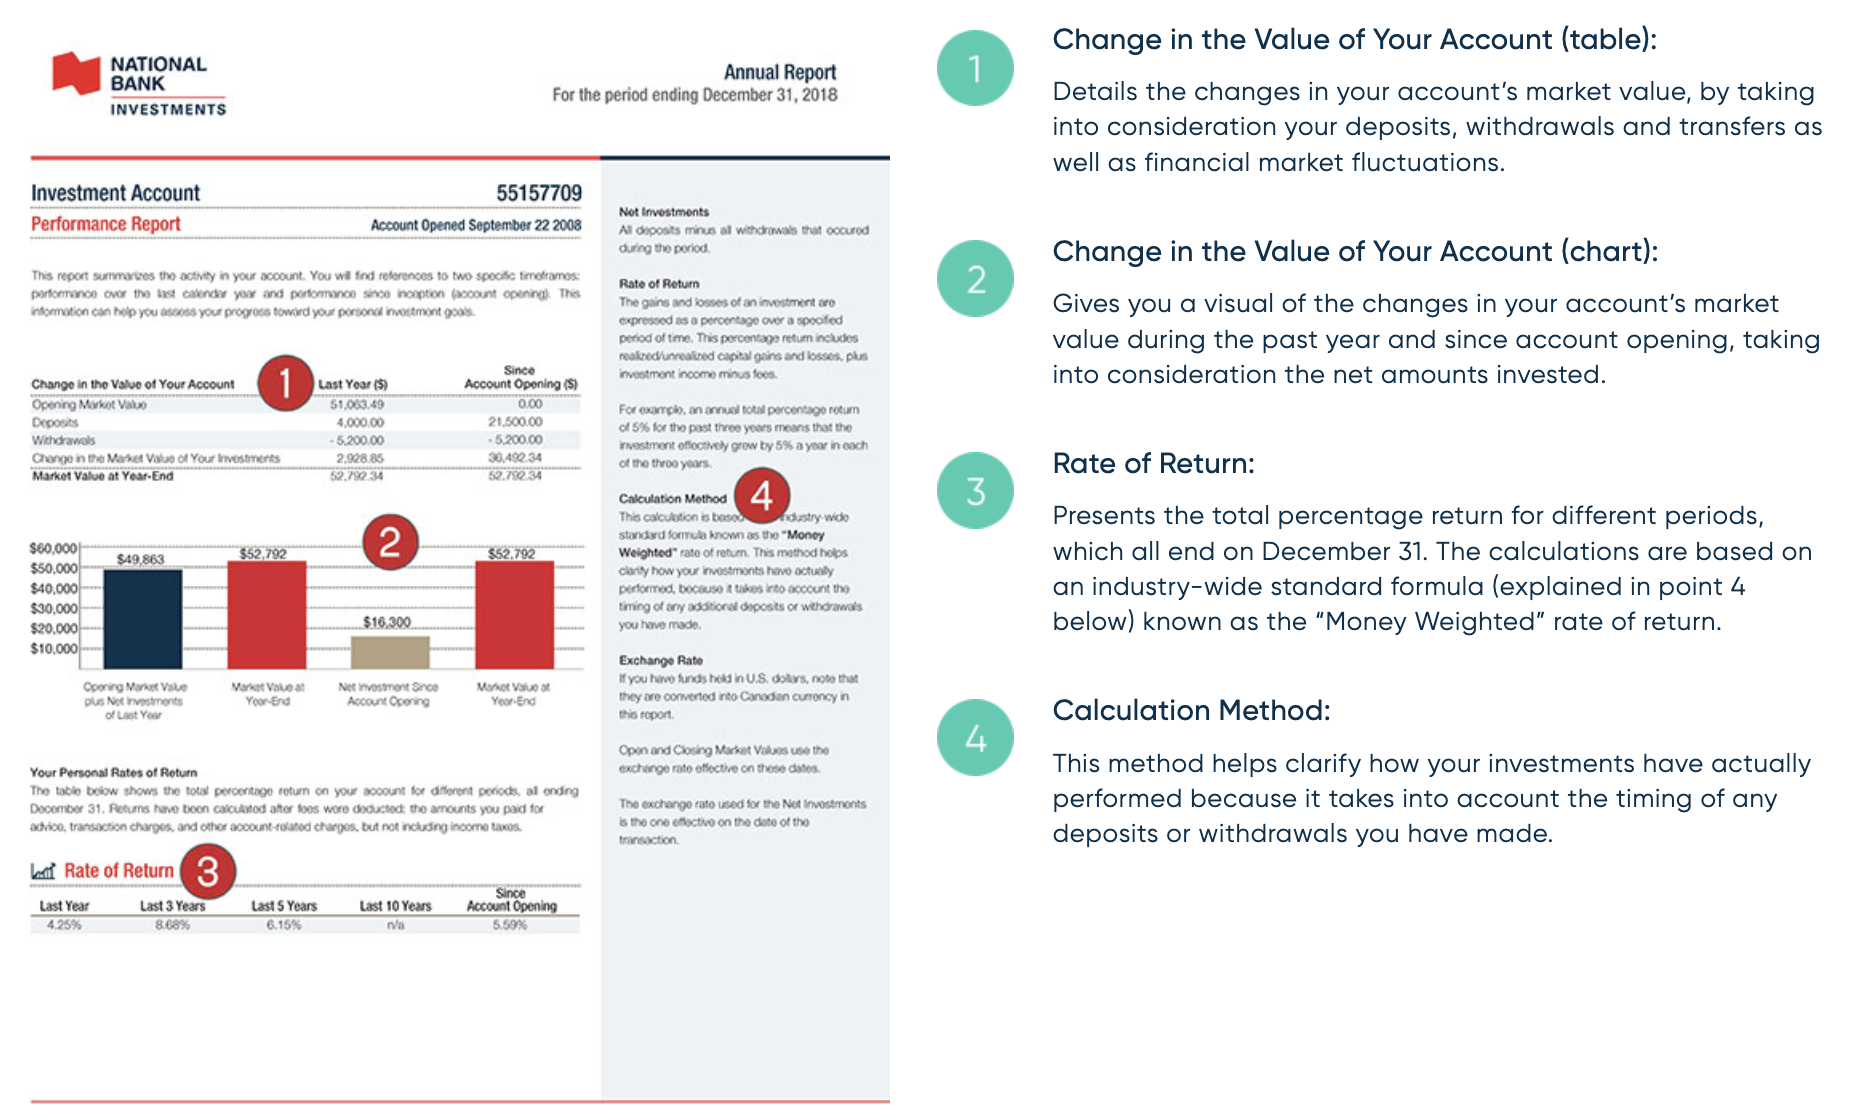
National Bank has done a decent job explaining how to interpret these reports as you can see below. They outline your starting balance for the year, any additions or withdrawals, and the dollar amount your investments have earned. For the visually inclined, there’s a handy graph and a chart depicting rates of return over various time frames. The industry has settled on the “Money-Weighted” formula for calculating rates of return. This formula is ideal for those practicing “Dollar-Cost Averaging,” which is a fancy way of saying “making regular contributions”, as it reflects how market timing has impacted your individualized overall return. However, it’s not the best metric for comparing the performance of different investments or institutions.
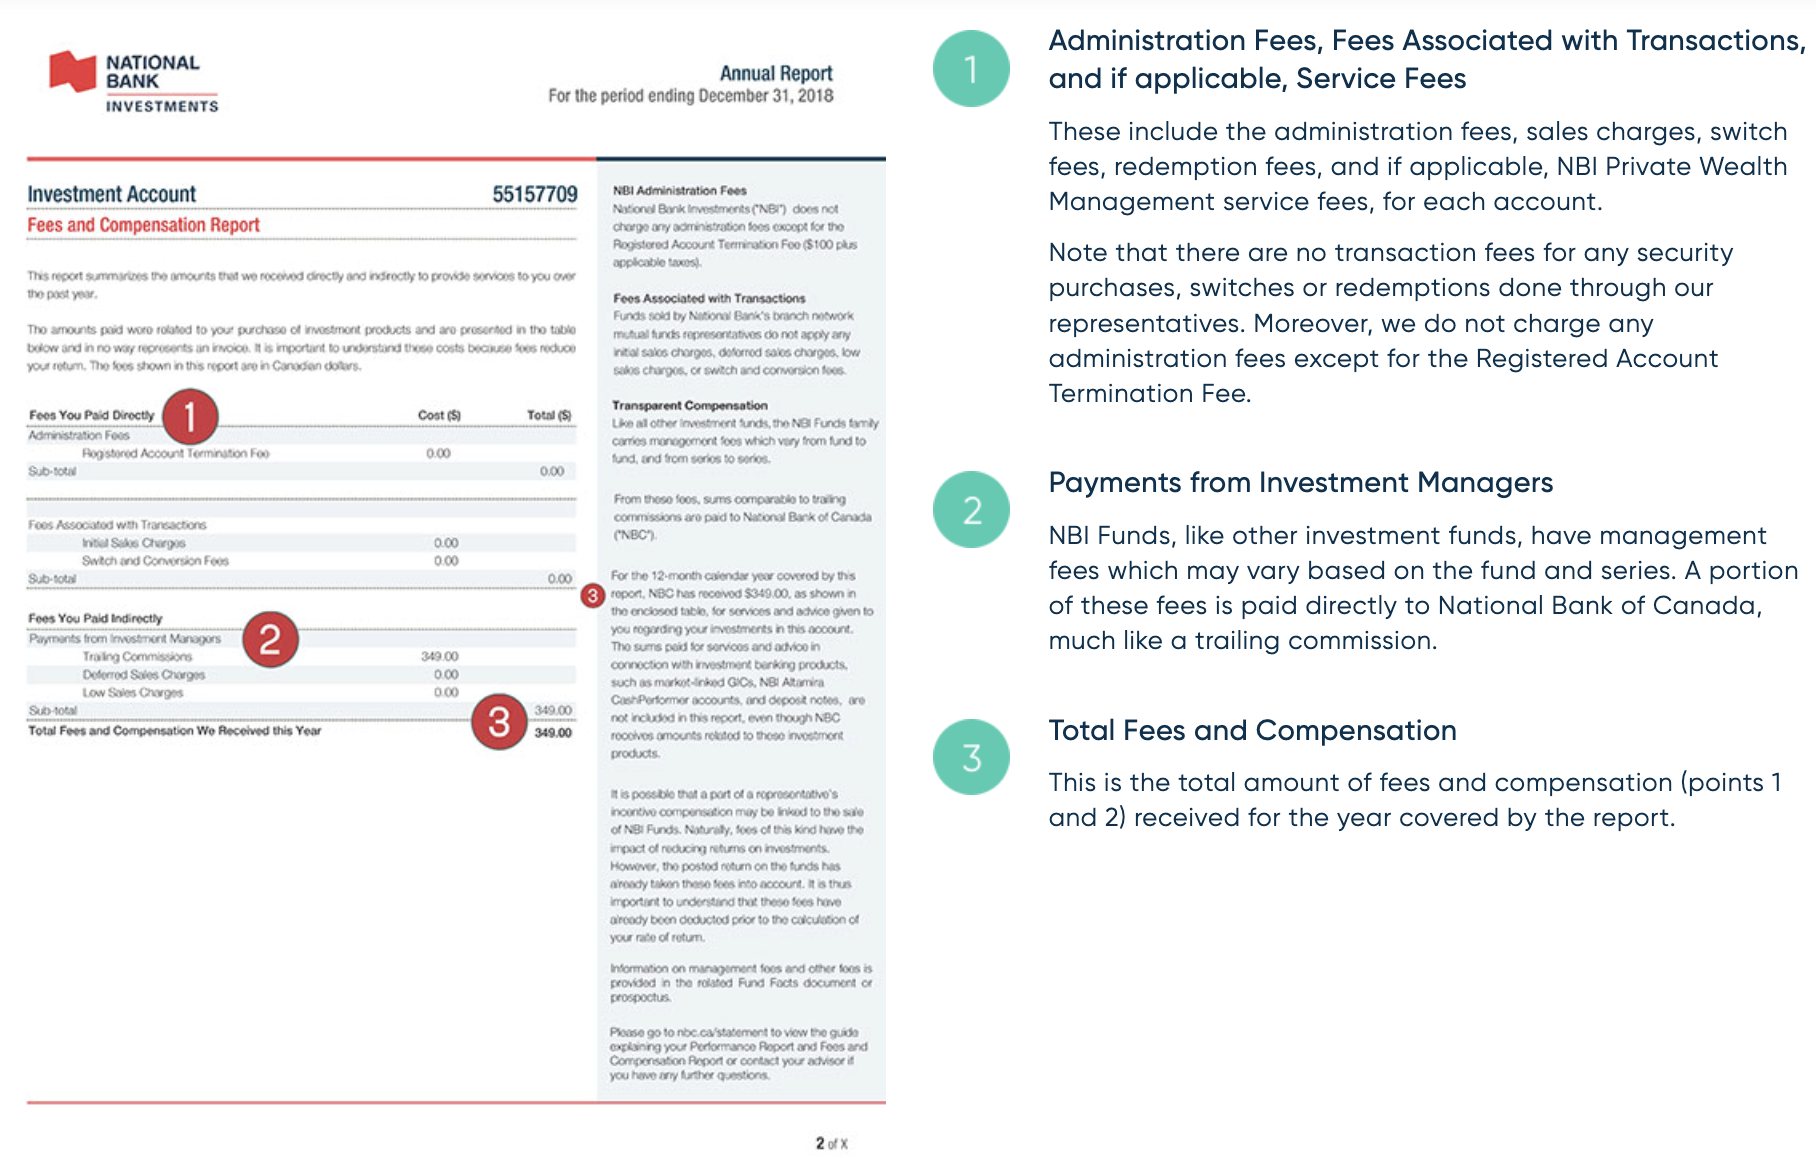
Equally crucial is understanding the value you’re getting for your money. The Annual Report provides a detailed breakdown of all the fees you’re paying. For those with non-registered investments, we utilize investment structures to ensure your fees are tax-deductible, so make sure to retain these figures for reporting purposes.
While you may not wish to scrutinize every line of your investment statement, knowing whether your investments are generating returns and what you’re paying in fees is crucial for making informed decisions. We’re here to help you navigate through the financial jargon and understand your assets better.
And to those of you with little ones, have a wonderful March Break!
Until next week, Happy Investing!
Trevor